A series of
celestial events taking place between the 24th and 28th of August, 2016 promise
the potential for severe weather that may be tropical in nature. Key
astronomical charts used in long-range weather forecasting place the planetary
alignments involving Mars, Saturn, Neptune, Venus, and Jupiter over
hurricane-prone sectors of the US East Coast.
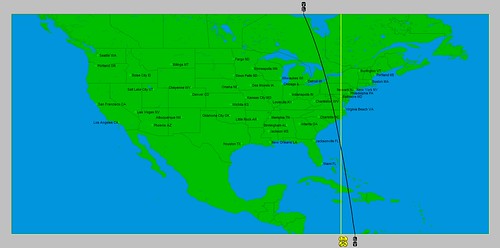
The
Mars-Saturn conjunction of August 24th begins the parade of celestial
harbingers. As seen from the astro-locality map below, their area of influence,
represented by the yellow lines, takes in the North Carolina and Virginia
coasts and into the Northeast. More importantly, the crossing of these lines
with the black line representing the influence of Neptune focuses their
energies about 250 miles off the coast of central Florida.
The
alignments of Mars, Saturn, and Neptune have been observed to correspond with
atmospheric turbulence, destructive, windy storms, and low pressure systems fed
by tropical moisture, which can be of greater significance when occurring
during hurricane season.
The second
astro-locality map shows the positions of the Venus-Jupiter conjunction of
August 27th represented by the blue lines over the New England area. These
lines also converge with the Mars and Saturn white lines south of New England.
Lastly, the Neptune line, shown in yellow, affects the Florida Panhandle
northward through the East Central US into the central Great Lakes region.
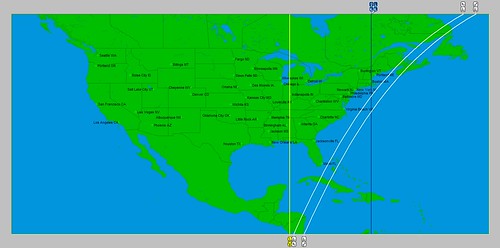
August 24-28, 2016
Taken
together, during the forecast period, the US East Central section is likely to
experience a bout of strong storms that push through the area towards the East
Coast. One likely scenario shows the development of a tropical system off the
coast of Florida which would then travel in parallel to the coast with a strong
chance of affecting the New England area. A second scenario calls for tropical
moisture, that doesn't develop into an organized tropical system, to be pulled
northward over the Carolinas fueling storms that affect the Mid-Atlantic,
Northeast, and New England areas.
Links to Other Long-range Weather Forecasts and Forecast Results
June 13-21, 2016 Long-range Weather Forecast
June 1-5, 2016 Long-range Weather Forecast
Hurricane Dolores Fulfills Long-range Weather Forecast
Hurricane Season 2015 Long-range Weather Predictions
Tropical Cyclone Hadi
Hurricane Erick Fulfills Long-range Forecast
Tropical Storm Andrea Fulfills Long-range Forecast!
Timing the Relief for Drought-Stricken U.S. Plains
Testing Astrometeorology Part 2
Hurricane Sandy Fulfills Long-range Weather Prediction!
Testing Astrometeorology Part 1
Hurricane Season 2011 Forecast Results
Hurricane Risk-Management
New Weather Alternative Website
Fulfilled Long-range Forecasts for Hurricane Season 2010
Introduction to the Weather Alternative
13 comments:
I just started reading your blog. I am wondering how these charts are generated? I tried running an Astrocartography chart for the maximum point of the solar eclipse in Madagascar but that did NOT give me similar lines. What time and place are you generating these charts for? Can you point me to where I can find info on McCormacks work or more instruction in what you are doing?
Hello again. I think I figured the charts out. I cast them from DC at the times mentioned and the lines coincide on 1 of charts checked. The second one was not at the time but about 4 hrs before the conjunct. Just curious why 2:07pm instead of 6:27pm for the Ven/Jup conj? Am I using the wrong place for that map?
BTW excellent call. It took 2 storms for the fulfillment but still excellent interpretation. I will be watching and learning. Need to go through all your posts now. Congratulations.
Hi, George! Thanks for your comments. The first chart is for the Mars-Saturn conjunction. The time was 6:26 am (CDT) August 24, 2016. The second chart is a bit trickier. It's set for the time for the Venus-Jupiter conjunction (5:28 pm CDT August 27, 2016) but as seen from the previous Solar Ingress. That is to say the Ingress of the Sun into Cancer on June 20, 2016 at 5:34 pm CDT. So one must first set the chart for the ingress and then see where the planets would have moved to by August 27, 2016 at 5:28 pm CDT. At that point, you will see Venus and Jupiter on the Midheaven through New England and Saturn and Mars on the Ascendant crossing Venus and Jupiter.
If you have Astrocartography capabilities, then use the times I gave you. It doesn't matter what location you use because the planetary lines on the map will be the same as my maps that I posted.
Check out this link for McCormack's book: https://www.amazon.com/Text-Book-Long-Range-Weather-Forecasting/dp/193330345X
Thank You for the response. I will see if I understand after looking at a few maps. Stay tuned. Looking at 2 formats of the same map. First is North America and second is World. These are available on astro.com.
Here are the ingress charts:
NA - http://oi66.tinypic.com/2qkjyid.jpg
World - http://oi68.tinypic.com/14msz0h.jpg
I am showing 2 because they have different map types. The World map has vertical MC/IC and are Mercator which are similar to what you show. The N. America are the same lines but get better detail.
I will look at the other charts again tomorrow.
You're right, the World Ingress map has lines similar to my Solar Fire maps. The next trick is to have the ingress map show where the planets had moved to by Aug 27th.
Not sure what you mean here - "So one must first set the chart for the ingress and then see where the planets would have moved to by August 27, 2016 at 5:28 pm CDT."
Or Here - "The next trick is to have the ingress map show where the planets had moved to by Aug 27th."
Using EDT @ 2:07 every thing matches up:
North America - http://oi67.tinypic.com/20qksvb.jpg
World - http://oi66.tinypic.com/2hfswvm.jpg
At 6:28 you see the Nep line way up at the upper right.
North America - http://oi64.tinypic.com/66yn1h.jpg
World - http://oi66.tinypic.com/efexb6.jpg
How do you start with the ingress and "show where the planets had moved to by Aug 27th" ?
For a check I tried looking at Mars on the ingress day and the V conj J day and it moved a bit over 18 degrees but the lines weren't 18 apart. I am stumped.
What I did was run various times until the Nep line and the others were close but that wouldn't allow me to run it on my own, only match what you did. That was how I got the 2:07 chart. Could it be that I need to match the Nep line of the Ingress chart with the 1 degree offset for movement?
Ok. Let's see if I can clear this up for you. I'm using Solar Fire which has Solar Maps included in it. If I erect a chart for the Solar Ingress, for example, I have the option of creating a "subsidiary" chart based on Solar Ingress chart.
So, for the charts we're discussing, you have the first part where you set up the Ingress chart and view the map. Now, if your program were able to create a subsidiary chart for August 27, 2016 5:28 pm CDT (which is the time of the Venus-Jupiter conjunction), you would see that chart second chart that I included in my original post about the hurricane where it shows Venus and Jupiter on the Midheaven through New England.
That's what I mean by "show where the planets had moved to by Aug 27th" and "So one must first set the chart for the ingress and then see where the planets would have moved to by August 27, 2016 at 5:28 pm CDT."
It's like having a natal chart and looking at where the planets are on a particular day. The angles of the chart have not changed, they remain stationary, but the planets are moving through the houses and at times crossing the angles. That's what's happening in the Solar Ingress chart when you create a subsidiary chart. The angles are staying the same but the planets are moving eastward.
So in the original Solar Ingress chart for June 20th, Jupiter is on the Midheaven through 81 West Longitude, but by August 27th, Jupiter is now over 70 West Longitude with Venus.
You may not have the capability to do this if the software or program you're using does not allow this type of modification.
Thank you for the clarification. I was able to figure it out by looking at both chart wheels. I then took the degree difference of 5 of the planets and moved them forward on the ingress map.
I must have made an error previously as the Mars did moved the appropriate amount. That, or I was looking at a ASC/DSC line instead of a MC/IC line. I also looked at the ASC itself.
The ASC moved 63 50 and that equates, using 4 mins per degree, to the 2:07 PM chart within a few minutes. So, even though the Astro.com travel maps don't have the subsidiary chart capabilities I can figure them out using a couple planets and the ASC movement.
Which leaves some questions. Do you look at both the actual chart and a subsidiary for every aspect that may have an influence? Why on the Mars/Sat did you use an actual chart and on the Ven/Jup use a subsidiary chart? How to know when to use which?
I hope someone else is curious about these same questions. I also found a clearer map to use and can zoom in if needed. On Astro.com, after you have data added and you go to the AstroClick Travel page you can choose Scalable Google Map (top edge of images) and get a map that you can move and zoom. Very handy when doing the adjustments and searching as I was. I also had a plain google maps page open for finding lat/lon as this map doesn't have that. In a google map if you right click and choose "What's Here" you will get the lat/lon.
Samples looking at US and zoomed out:
http://oi68.tinypic.com/29vdlyx.jpg
http://oi66.tinypic.com/o72bz9.jpg
Thank you Ken. Appreciate the help.
BTW you can also add aspects to those Scalable maps. See the check boxes just below the title area of the map. Some interesting disharmonious aspects on that Ingress chart.
I'm glad you got your maps program to portray the maps the way Solar Fire does. Thanks for the links as they may come in handy.
I will look at both the actual chart and the subsidiary chart for important charts such as the Solar Ingress, Lunar Phase charts (New Moon, Full Moon and Quarter Moon), and Eclipse charts. The actual chart will show what the general influence for an area is and may be important if one of the "radical" that is to say original positions are receiving an important aspect. The subsidiary chart will show where the aspects between transiting planets is being localized, which will probably have moved away from the positions that the radical planets held.
Since the Mars/Saturn aspect did not appear in any important charts but was prominently placed in the chart for the aspect itself, I knew that it was an important chart in its own right.
The way to know the difference is to look at where, geographically, a certain aspect is operating by looking at a number of important charts and seeing if a particular place is being singled out or emphasized. This will vary. In this case, I found that the Mars/Saturn chart and the Subsidiary chart for the Venus/Jupiter aspect in the Solar Ingress were building a case for a weather event off the U.S. East Coast.
Thank you again. Lots to digest and look at. Do you have any upcoming forecasts?
I don't have any at the moment, but I do need to dedicate some time to that and come up with some new ones.
Post a Comment